|
Home
What's New
Location
Equipment
Software
Methods
Results
Gallery
Links
Ephemerides
Moon etc
Meetings
Contact Us
Site Map
| |
Screen Ruler
 |
Screen Ruler Overview |
|
Downloads User guide (html) (PDF) |
|
(Note: This overview covers version 1.0.28 (2021).
Major improvements are now available, see user guide, including
tutorials for version
1.0.34)
If a faint asteroid is moving through a dense star field it can be
difficult to get an accurate positional measurement. Many images may
need to be taken and stacked
together to reveal the asteroid and if the asteroid is moving fast the
stars will appear as long streaks. If the asteroid passes close to any
of the stars in the field then the star light can entirely hide the
asteroid, or at best "pull" the centre of
light of the asteroid away from where it should be, this showing up
eventually as poor residuals when the measurements are used to calculate an
orbit.
Screen Ruler is designed to quickly and easily find the images in a
stack made with Astrometrica when the asteroid gets too close to field stars so that the
good images can be identified and stacked, to reveal the asteroid. Another technique that achieves a similar
result is using a 'Median' stack, removing stationary objects as long as
the target is moving at a reasonable rate. However, the quality of
measurement from a median stack is often inferior to an 'Add' stack. See
results below.
As an example and using Astrometrica, here is a set of 60 images of Near-Earth Object 2021
BJ1 on 23-Jan-2021, at the time it was expected to be magnitude +19.8.
The images have been track and stacked together, compensating for the motion of 15 arc-seconds per
minute in P.A. 299°. It is very difficult to see the NEO at all.
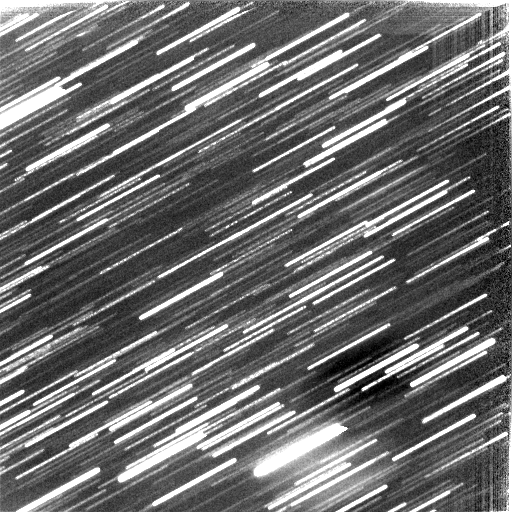
Here the area around the minor planet in the same image is magnified
and the feeble glow of the object, mixed up with starlight is circled:
|
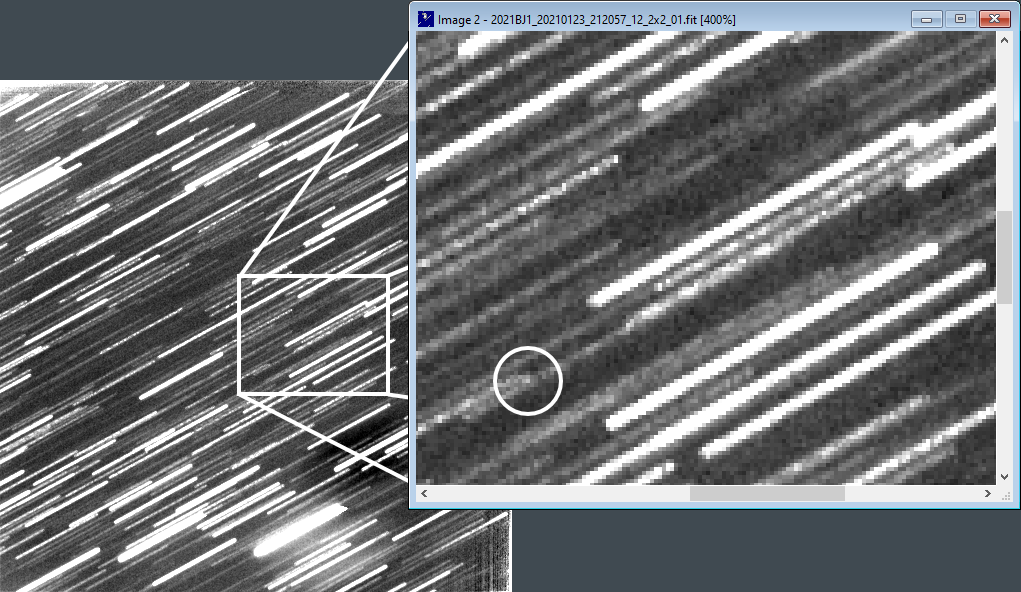 |
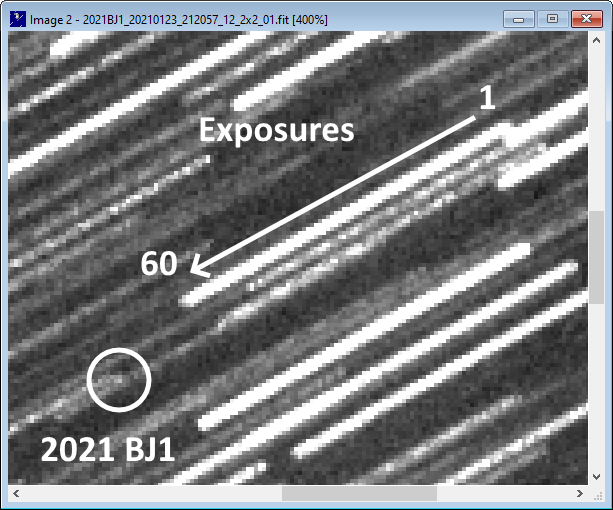
| Note that there are several star trails that
overlap the minor planet. The minor planet was moving from lower left to
upper right, but the track and stack procedure holds it steady in one place,
building up and strengthening its light using all 60 exposures. The stars are then forced
to trail in the
opposite sense to the minor planet's motion, their trails start at top right
with the first exposure and
end to lower left with the 60th:
When Screen Ruler is launched, two windows appear, the semi-transparent
Measurement window and the Control window, both are set to display above
other windows so are always available, even when working with
Astrometrica:
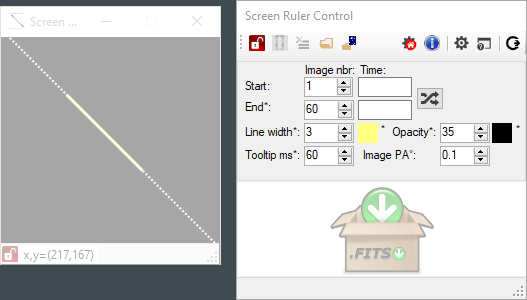
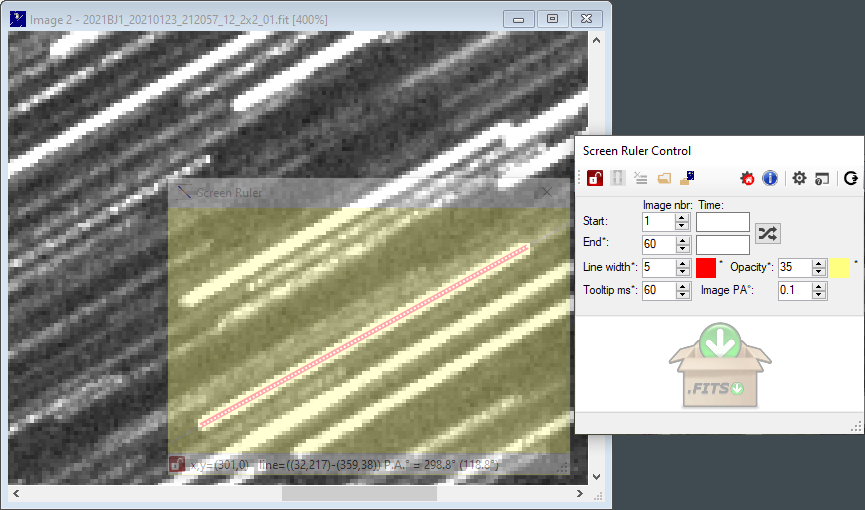
The first step is to drag and resize the Measurement window so that
it fits completely over a star trail. Here the Control window has also been
used to change the colours used in the Measurement window to make it stand
out more clearly in these screen shots. Any star trail where start and end points are both visible
can be used
to draw a line with the ruler, in the direction of the asteroid's motion. There are a
number of different ways to set the ruler start and end points, see the
User Guide for more information:
|
 |
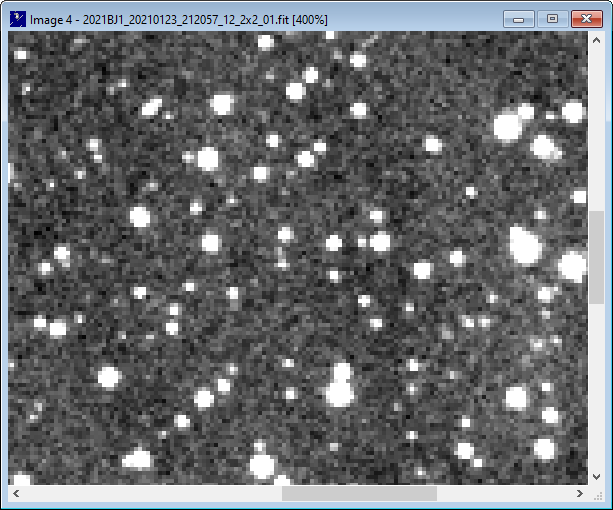
| Next, another stack (from the same
set of images) is
made using 'Add', but this time with zero motion, so that the star field
can be seen without star trails. This stack needs to start with the
first image used in the track & stack image, but only enough of the images need
to be used to see fainter field stars well. Here images 1 - 10 of the 60
available have been
stacked, with zero motion:
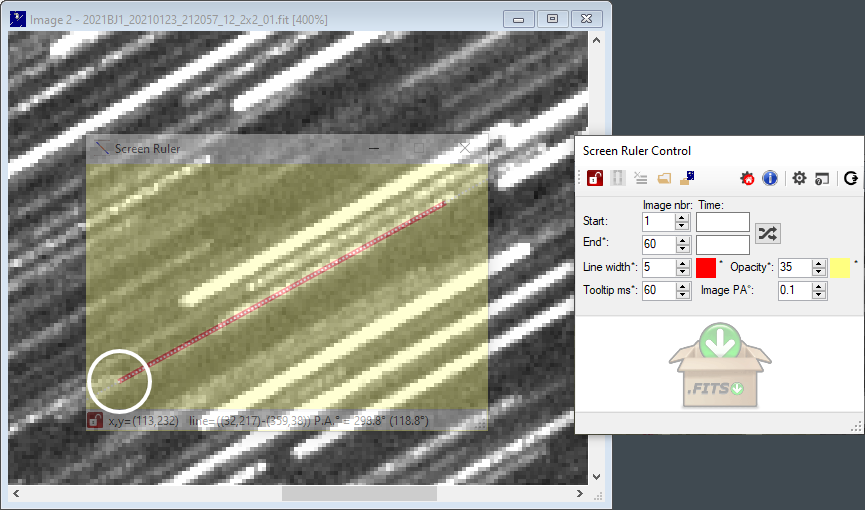
Now, using Astrometrica's blink function, the track
and stacked image is
blinked with the zero motion image. Astrometrica aligns them so where the faint light of the asteroid can be
seen in the track and stacked image, that is exactly where the asteroid was during exposure 1 in the
zero motion stack.
The Measurement window is then dragged (by the title bar so it does
not resize) and placed so that the start of the ruler lies exactly
over the faint dot of the asteroid, circled in the image below:
|
 |
| Next, Astrometrica's Single step forward
(Ctrl+F10) button is pressed to display the zero motion stack, leaving
the Measurement window untouched. Now the
Measurement window ruler shows the asteroid's path through the star
field and the stars that the asteroid passed close by are now obvious: |
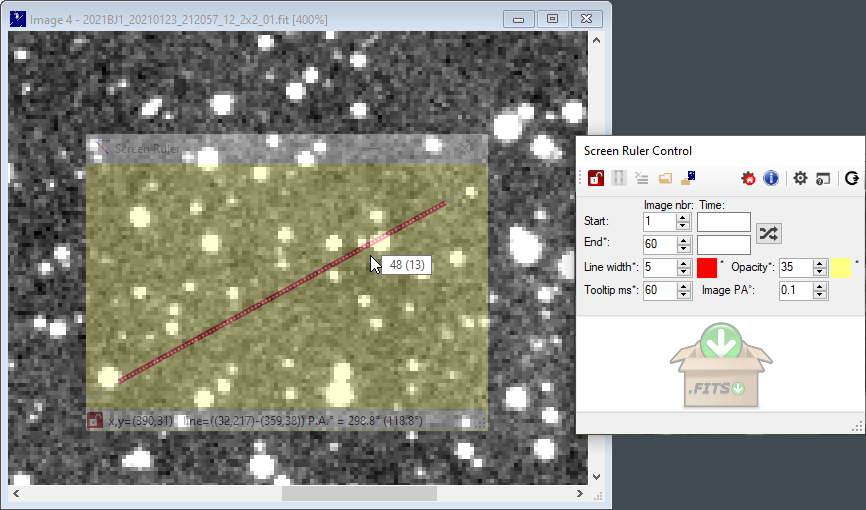 |
| If the Mouse is moved over the Measurement
window the program will interpolate between the first and last image to
show the likely sequential image number nearest the mouse position. Here the mouse is
near a bright star on the path of the asteroid and shows that it was
around the 48th exposure (or 13th, counting from the last exposure
backwards). |
| However, if the FITS image files contain standard
FITS keyword information for the start of exposure and exposure length
(DATE-OBS and EXPOSURE keywords),
the FITS files can be dragged and dropped
onto the FITS area of the Control window using Windows File Explorer to give the Measurement
window
exact information of where the individual exposures start and stop. Here
all 60 files have been selected in Windows File Explorer and have been dropped onto the Control window, filling the FITS area: |
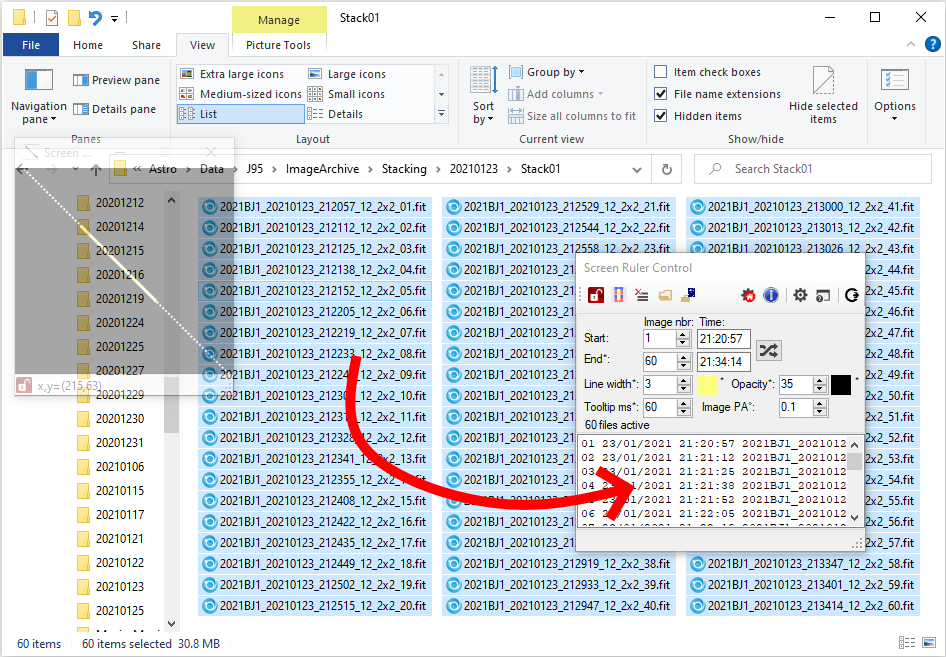 |
The Control window shows 60
files are now active and the individual file names and their exposure
start times appear in the FITS area. The Control window can be resized
to show the full file names if needed.
The toolstrip button 'Show exposure start and end
boundaries'
 will now toggle the display in the Measurement
window of the individual exposure start and end positions, with
alternating coloured bars (the 'ladder'): will now toggle the display in the Measurement
window of the individual exposure start and end positions, with
alternating coloured bars (the 'ladder'): |
| The mouse will now read out the sequential
number of the exposure closest to the mouse but also the file name. The
files that need to be left out can be quickly and easily identified and
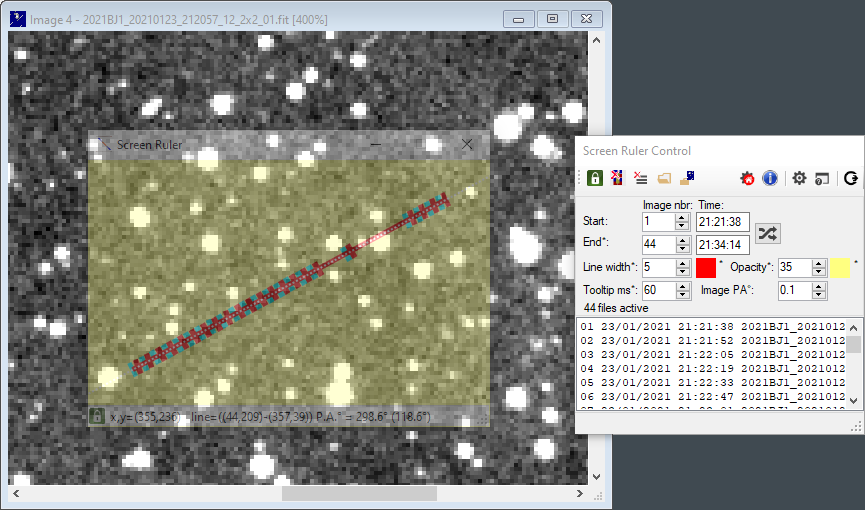
the good images restacked in Astrometrica to get a good astrometric measurement. Here is
the result, 16 images have been identified as bad (1-3, 38-41 and 44-52) and the remaining 44
good files have been dropped back onto the Control window, to show the
location of the
images to be used, with the NEO avoiding the field stars: |
 |
Here is a comparison of the Astrometrica
Verification measurement window for three solutions, using:
1. All 60 images stacked (with star trail interference)
2. The same images Median stacked
3. 44 images stacked after 16 images rejected using Screen Ruler |
1. 60 images 'Add' stacked

The centre of light is visibly 'pulled' to the left of the brightest
pixel from the asteroid, SNR is low at 5.5 and fit RMS is also poor at
0.154. The measured magnitude is 1.6 magnitudes brighter than predicted
because of the addition of stray starlight from the trails.2. 60 images 'Median' stacked

A good, well centred measurement, but SNR at only 3.9 and fit RMS are still not
ideal.
3. 44 images stacked after 16 images rejected

Note the difference in Signal to Noise ratio
between solutions 2 and 3. The Median stack has revealed the object well, but the SNR is just 3.9, the 44 stacked images from the Screen Ruler solution,
with 27% less exposure has registered a significantly better SNR of 13.4, and with an RMS fit about twice as good. The magnitude is also
closer to predicted, without the influence of stray starlight. |
| The Screen Ruler has more functionality
not covered here, including a
magnifier, a perpendicular line facility and a selection of keyboard and
mouse methods to control the screen. See the Screen Ruler
User Guide for
more information. |
|